
NQ failed-breakout indicator

BRFailedBreakout

A NinjaTrader 8 indicator designed to identify failed breakout conditions at structural levels placed on the chart by the user—where an apparent break loses acceptance and price returns through the level.
NQ FuturesORENKO 40/24/70NinjaTrader 8Windows
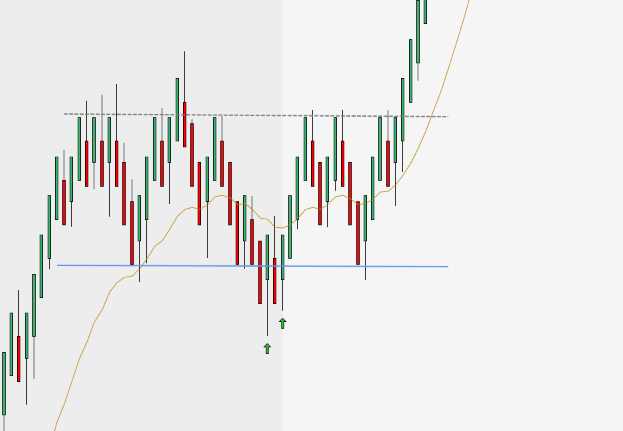
NQ ORENKO chart showing a failed breakdown below user-defined support, green bearish-failure arrows, and the subsequent rally
Failed breakdown below user-defined support · bearish failure example
$249
Permanent license
User-defined levelsThe trader places structural support and resistance on the chart
Two directionsRecognizes bullish and bearish failure conditions
Clear arrowsCompact chart markers keep price action visible
IndependentRuns without BRStrongTrend
What it is designed to recognize

When the breakout fails, the structure changes.

BRFailedBreakout focuses on the transition from apparent breakout to rejection. It helps make the pattern easier to recognize while leaving location, room, risk, and execution decisions with the trader.

01

User-defined structural levels

The trader identifies and places the relevant support and resistance levels. BRFailedBreakout then monitors price behavior around those selected boundaries.

02

Failure to hold the breakout

Looks for the return through the broken boundary that distinguishes rejection from continued acceptance beyond the level.

03

Bullish and bearish conditions

Supports failed breakdowns below support and failed breakouts above resistance within the Black Raven framework.

04

Uncluttered visual confirmation

Plots a directional chart arrow so the trader can evaluate the condition in its full structural context.

How to read the output
A failed break is the event. Location gives it meaning.

The chart example shows price moving below user-defined support, failing to hold below the level, and reversing higher. The green arrows identify the bearish failure; they do not replace trade qualification.

↑

Green arrow · bearish failure

Highlights a bearish break below support that failed, with price potentially reversing back above the boundary.

↓

Red arrow · bullish failure

Highlights a bullish break above resistance that failed, with price potentially reversing back below the boundary.

Indicator versus trader

Recognition is automated. Level selection and trading decisions are not.

BRFailedBreakout identifies

  • Potential failed breaks at the user’s selected boundaries
  • Bullish and bearish failure conditions
  • Return through the broken support or resistance area
  • A clear directional marker on the chart

The trader defines and evaluates

  • Placement, quality, and importance of each structural level
  • Available room to the next target or opposing structure
  • Broader trend, range, and market context
  • Entry, stop, target, position size, and trade management
Requirements and planned license
Designed for the Black Raven environment.
PlatformNinjaTrader 8
Operating systemWindows only
MarketNQ futures
ChartORENKO 40/24/70
DeliveryCompiled indicator download
ActivationOne computer · Machine ID
Machine resetsTwo complimentary resets per 12 months
UpdatesLifetime bug fixes and indicator updates
InstallationPDF instructions and installation support
ConsultationTrading-strategy consultation not included

BRFailedBreakout for NinjaTrader 8

Permanent single-computer license with Machine-ID activation, installation instructions, and two complimentary machine resets within each 12-month period.

$249
Available at launch
BRFailedBreakout is an analytical aid, not an automated trading strategy. The user is responsible for selecting and placing structural levels. It does not place orders, determine position size, or guarantee profitable outcomes. Futures trading involves substantial risk. Proprietary thresholds and calculation logic are not disclosed.